Observation Overview
Like all good astronomers I used telescopes to collect data and to learn specific information about the stars I was modeling. There were two types of data collected for use in this project: Photometry and Spectroscopy. The photometry tells astronomers about the changes in a star's brightness. These changes are likely caused by dark spots on a star which can rotate into view or by flares which briefly raise the brightness of a star. Spectroscopy is a method used by astronomers to break the light from a star into its constituent wavelengths. Each star has a unique spectra, like a fingerprint, which can tell us about a star's composition and behavior.
Photometry
Most of the data in this project came from NASA's Kepler mission which is a 0.95 meter telescope in an Earth trailing orbit. It is most famous for discovering hundreds of new planets but is also a phenomenal instrument for studying stars as it gave astronomers 4 years of continuous coverage on hundreds of thousands of stars. The data from Kepler comes to us in the form of lightcurves, as seen below, this is simply a measure of a star's brightness and how it changes of time.
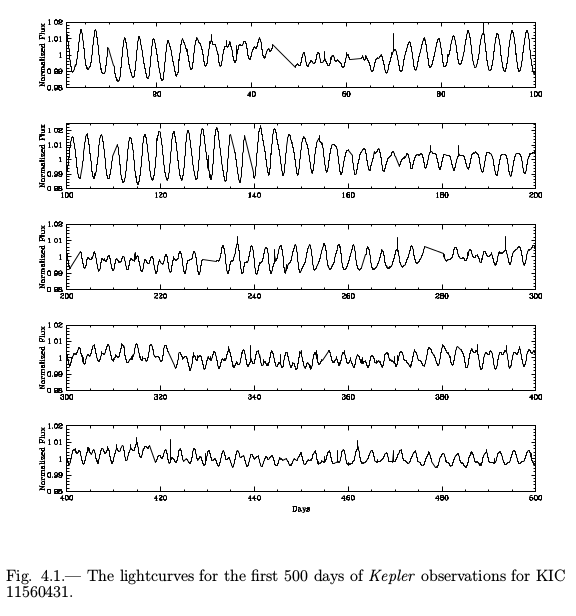
The model I developed is designed to reproduce the changes in a lightcurve by recreating the physical structures on a star's surface. This is accomplished by modeling dark spots on a star which rotate in and out of view as time passes. Each of these spot's have four modeled parameters: Latitude, Longitude, Rotational Period, and Size. From the latitudes and rotational periods of the spots I can determine the differential rotation of a star which is the whole point of all this! I'll elaborate on how the model works later on.
Spectroscopy
While the photometric data is required for the model function there are additional data only attainable from spectroscopy which the model can use as well. The largest single obstacle in the type of modeling used in this type of project is the latitude-inclination degeneracy. Put simply, without knowing what a star's inclination relative to the Earth the model cannot accurately determine differential rotation of that star. To get around this I used spectroscopy, taken on the 3.5 meter telescope at Apache Point Observatory, to determine a star's inclination. Specifically the observation I made is known as v sin(i), which is an inclination dependant measurement of a star's rotational velocity. Using singal analysis techniques I was able to determine the rotational velocity of a star, I also had the radius for my stars so I only needed to compute the inclination.
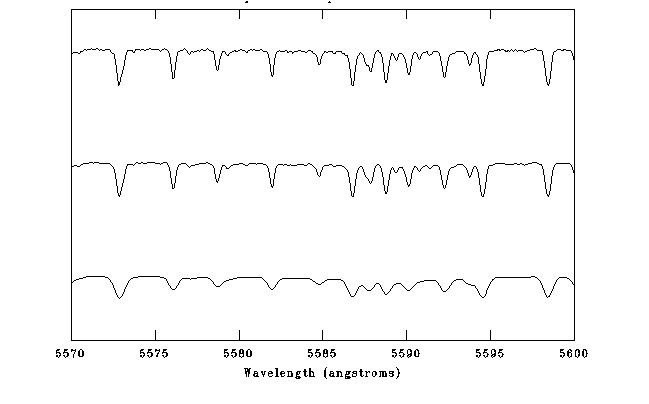
The process of actually getting the v sin(i) is acutally a little more complicated than what I have discussed here. Chapter 2: Section 3 of my thesis discusses the details but essentially what I did was to create artificial stars which rotated faster and slower than my targets. Then I compared the spectra of my targets to the fake stars I created and from there I could determine what the v sin(i) was. The following figure shows this with the top spectra representing actual data, the second spectra represents an artificial star with the same rotational velocity, and the third spectra is an artificial star with faster rotation. Note that the faster rotating star has shallower, but broader spectral features.
Back to my homepage